Validating against ODE
Validation of Gillespie algorithm and disease transmission code in C
Comparing results from pure Stochastic Gillespie Algorithm (pure SSA) i.e. all disease status transition occurs probalistically with ignoring the history of their status (e.g. how long being already being infectious doesn ot affect the timing of an individual to become immune) to ODE
And comparing results from modified Gillespie Algorithm (modified SSA) i.e. disease status transition occurs considering their disease status history
Read simulated output from C
#=========================================================================================
# make sure the path is correct: you need to put simulated output from modified_SSA.c in "E:/tem/analysis" and outout from SSA.c in  "E:/tem/analysis/SSA", or alternatively anywhere that suits you. If latter, make sure you change
# location variable to a proper name

# Read data for modified SSA
location = "E:/tem/analysis"
setwd(location)
lf_r<-list.files(path=location,full.names=F,pattern="csv")
data_list<-lapply(lf_r,function(i){
  read.table(i,header = FALSE, sep = ",")
})

for(i in seq(data_list))
{
  num<-gsub("\\D","",substring(lf_r[i],21,22))
  assign(paste0("df",num),data_list[[i]])

}

# Read SSA data
location = "E:/tem/analysis/SSA"
setwd(location)
lf_ssa<-list.files(path=location,full.names=F,pattern="csv")
data_ssa_list<-lapply(lf_ssa,function(i){
  read.table(i,header = FALSE, sep = ",")
})

for(i in seq(data_ssa_list))
{
  num<-gsub("\\D","",substring(lf_ssa[i],24,25))
  assign(paste0("df_ssa",num),data_ssa_list[[i]])

}
Preprare Plot for 100 simulated results from C code both pure SSA and modified SSA
#=========================================================================================
library(ggplot2)

p_s <-p_e<-p_i<-p_r<- ggplot()

for(i in seq(data_list))
{
  tem<-get(paste0("df",i-1))
  tem <- data.frame(t(tem))
  tem <- tem[tem$X1>0 & !is.na(tem$X1),]
  colnames(tem)[1] <- "TIME"
  colnames(tem)[2] <- "S"
  colnames(tem)[3] <- "E"
  colnames(tem)[4] <- "I"
  colnames(tem)[5] <- "R"
  tem <- tem[tem$TIME<=100,]
  loop_input <- "geom_line(data=tem,aes(x = TIME, y = S),color='lightblue')"
  p_s <- p_s + eval(parse(text=loop_input))
  loop_input <- "geom_line(data=tem,aes(x = TIME, y = E),color='lightblue')"
  p_e <- p_e + eval(parse(text=loop_input))
  loop_input <- "geom_line(data=tem,aes(x = TIME, y = I),color='lightblue')"
  p_i <- p_i + eval(parse(text=loop_input))
  loop_input <- "geom_line(data=tem,aes(x = TIME, y = R),color='lightblue')"
  p_r <- p_r + eval(parse(text=loop_input))
}

#Do same for SSA
p_s_ssa <-p_e_ssa <-p_i_ssa <-p_r_ssa <- ggplot()

for(i in seq(data_ssa_list))
{
  tem<-get(paste0("df_ssa",i-1))
  tem <- data.frame(t(tem))
  tem <- tem[tem$X1>0 & !is.na(tem$X1),]
  colnames(tem)[1] <- "TIME"
  colnames(tem)[2] <- "S"
  colnames(tem)[3] <- "E"
  colnames(tem)[4] <- "I"
  colnames(tem)[5] <- "R"
  tem <- tem[tem$TIME<=100,]
  loop_input <- "geom_line(data=tem,aes(x = TIME, y = S),color='lightblue')"
  p_s_ssa <- p_s_ssa + eval(parse(text=loop_input))
  loop_input <- "geom_line(data=tem,aes(x = TIME, y = E),color='lightblue')"
  p_e_ssa <- p_e_ssa + eval(parse(text=loop_input))
  loop_input <- "geom_line(data=tem,aes(x = TIME, y = I),color='lightblue')"
  p_i_ssa <- p_i_ssa + eval(parse(text=loop_input))
  loop_input <- "geom_line(data=tem,aes(x = TIME, y = R),color='lightblue')"
  p_r_ssa <- p_r_ssa + eval(parse(text=loop_input))
}
ODE for a within-farm transmission
#===========================================================================
library(deSolve)

#setup disease dynamic function
SEIR.dyn <- function(t,var,par){
  S <- var[1]
  E <- var[2]
  I <- var[3]
  R <- var[4]
  N <- S + E + I + R
  beta <- par[1] #S->E
  gamma <- par[2] # E->I
  delta <- par[3] #I->R
# Derivatives
  dS <- -beta*S*I/N
  dE <- beta*S*I/N - gamma*E
  dI <- gamma*E - delta*I
  dR <- delta*I
# Return the derivatives
  list(c(dS,dE,dI,dR))
}

# Set up parameter
beta <- 0.5
gamma <- 1/25 #expected value for E->I in IBM
delta <- 1/50 #expected value for I->R in IBM
SEIR.par <- c(beta,gamma,delta)

SEIR.init <- c(499,0,1,0) #one infectious

SEIR.t <- seq(0,100,by=0.1)

# Run ODE
SEIR.sol <- lsoda(SEIR.init,SEIR.t, SEIR.dyn, SEIR.par)


#Rename results
SEIR.sol <-data.frame(SEIR.sol)
colnames(SEIR.sol)[1] <- "TIME"
colnames(SEIR.sol)[2] <-"S"
colnames(SEIR.sol)[3] <-"E"
colnames(SEIR.sol)[4] <-"I"
colnames(SEIR.sol)[5] <-"R"
Plot and compare results from C (pure SSA and modified SSA) and R (ODE)
#========================================================================
## Pure SSA
# Susceptible: blue(stochastic output from C) and black(ODE from R)
p_s_ssa_combined <- p_s_ssa + geom_line(data=SEIR.sol,aes(x=TIME,y=S),color="black",size=1)

# Exposed: blue(stochastic output from C) and black(ODE from R)
p_e_ssa_combined <- p_e_ssa + geom_line(data=SEIR.sol,aes(x=TIME,y=E),color="black",size=1)

# Infectious: blue(stochastic output from C) and black(ODE from R)
p_i_ssa_combined <- p_i_ssa + geom_line(data=SEIR.sol,aes(x=TIME,y=I),color="black",size=1)

# Immune: blue(stochastic output from C) and black(ODE from R)
p_r_ssa_combined <- p_r_ssa + geom_line(data=SEIR.sol,aes(x=TIME,y=R),color="black",size=1)

p_s_ssa_combined
## geom_path: Each group consists of only one observation. Do you need to
## adjust the group aesthetic?
## geom_path: Each group consists of only one observation. Do you need to
## adjust the group aesthetic?
## geom_path: Each group consists of only one observation. Do you need to
## adjust the group aesthetic?
## geom_path: Each group consists of only one observation. Do you need to
## adjust the group aesthetic?
## geom_path: Each group consists of only one observation. Do you need to
## adjust the group aesthetic?
## geom_path: Each group consists of only one observation. Do you need to
## adjust the group aesthetic?
## geom_path: Each group consists of only one observation. Do you need to
## adjust the group aesthetic?
## geom_path: Each group consists of only one observation. Do you need to
## adjust the group aesthetic?
## geom_path: Each group consists of only one observation. Do you need to
## adjust the group aesthetic?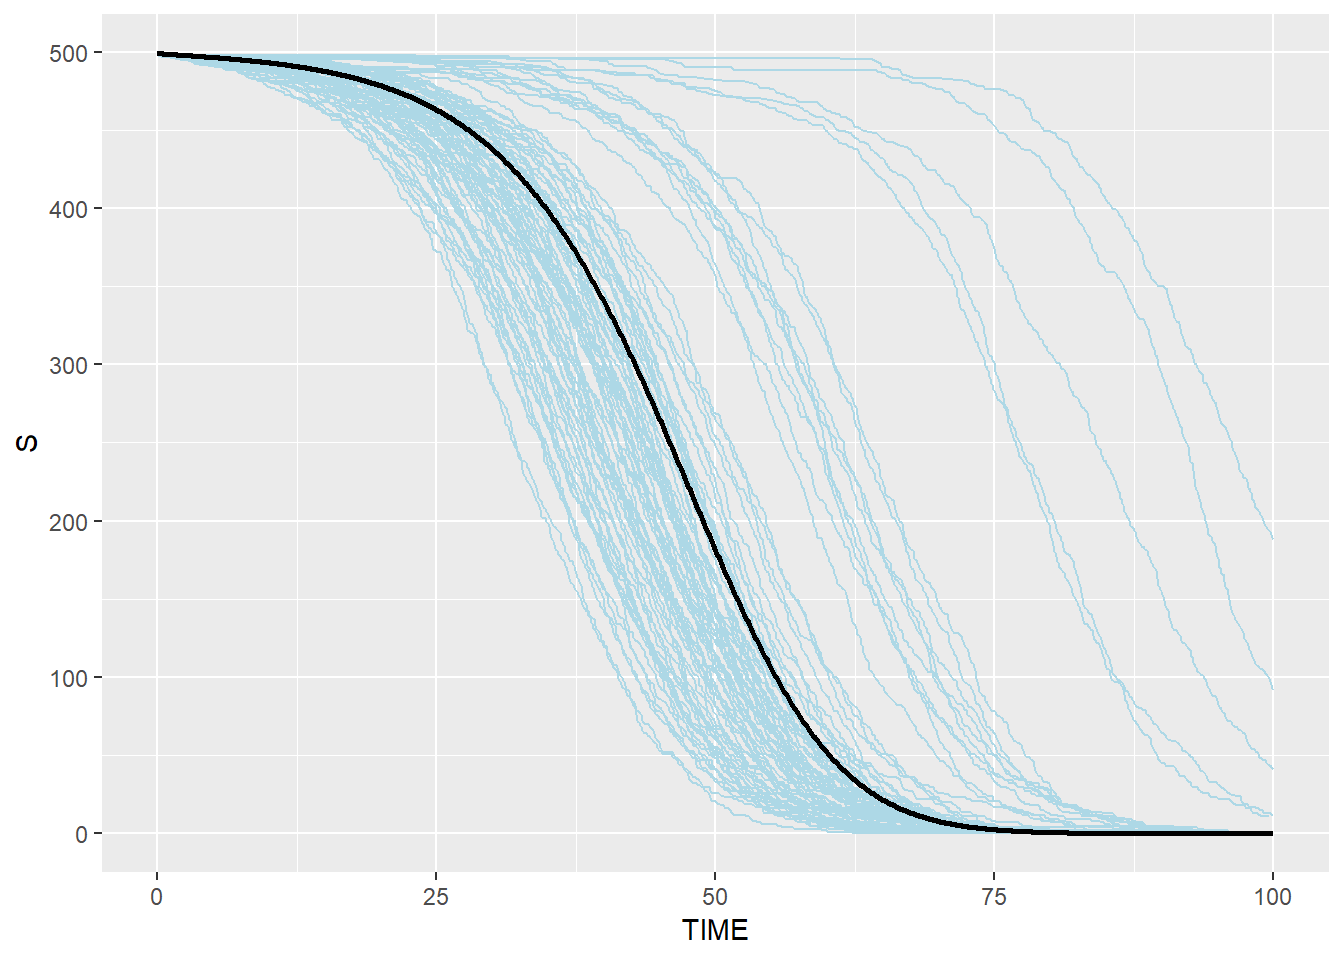
p_e_ssa_combined## geom_path: Each group consists of only one observation. Do you need to
## adjust the group aesthetic?
## geom_path: Each group consists of only one observation. Do you need to
## adjust the group aesthetic?
## geom_path: Each group consists of only one observation. Do you need to
## adjust the group aesthetic?
## geom_path: Each group consists of only one observation. Do you need to
## adjust the group aesthetic?
## geom_path: Each group consists of only one observation. Do you need to
## adjust the group aesthetic?
## geom_path: Each group consists of only one observation. Do you need to
## adjust the group aesthetic?
## geom_path: Each group consists of only one observation. Do you need to
## adjust the group aesthetic?
## geom_path: Each group consists of only one observation. Do you need to
## adjust the group aesthetic?
## geom_path: Each group consists of only one observation. Do you need to
## adjust the group aesthetic?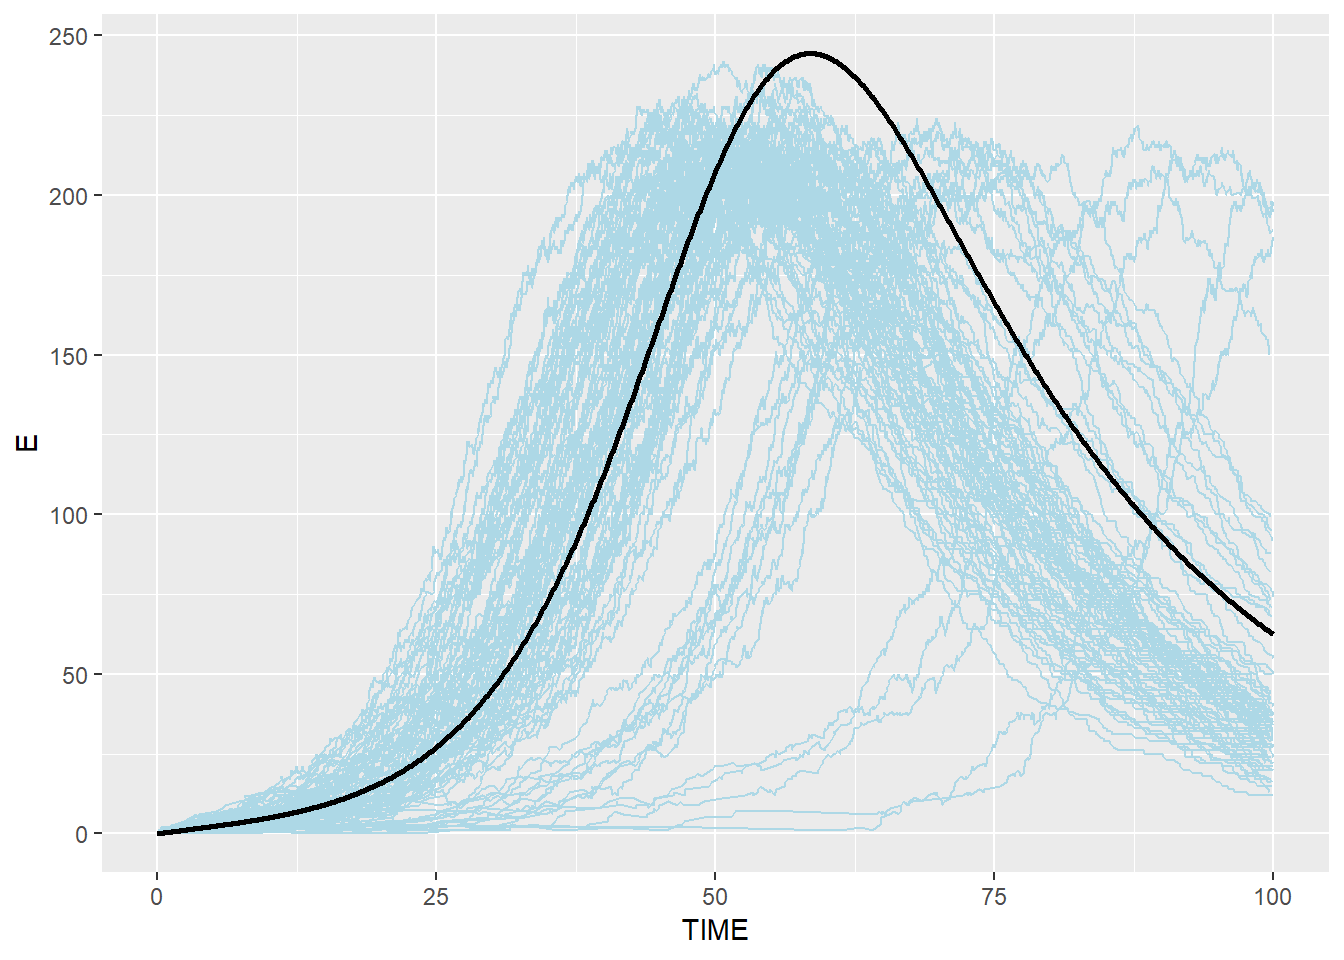
p_i_ssa_combined## geom_path: Each group consists of only one observation. Do you need to
## adjust the group aesthetic?
## geom_path: Each group consists of only one observation. Do you need to
## adjust the group aesthetic?
## geom_path: Each group consists of only one observation. Do you need to
## adjust the group aesthetic?
## geom_path: Each group consists of only one observation. Do you need to
## adjust the group aesthetic?
## geom_path: Each group consists of only one observation. Do you need to
## adjust the group aesthetic?
## geom_path: Each group consists of only one observation. Do you need to
## adjust the group aesthetic?
## geom_path: Each group consists of only one observation. Do you need to
## adjust the group aesthetic?
## geom_path: Each group consists of only one observation. Do you need to
## adjust the group aesthetic?
## geom_path: Each group consists of only one observation. Do you need to
## adjust the group aesthetic?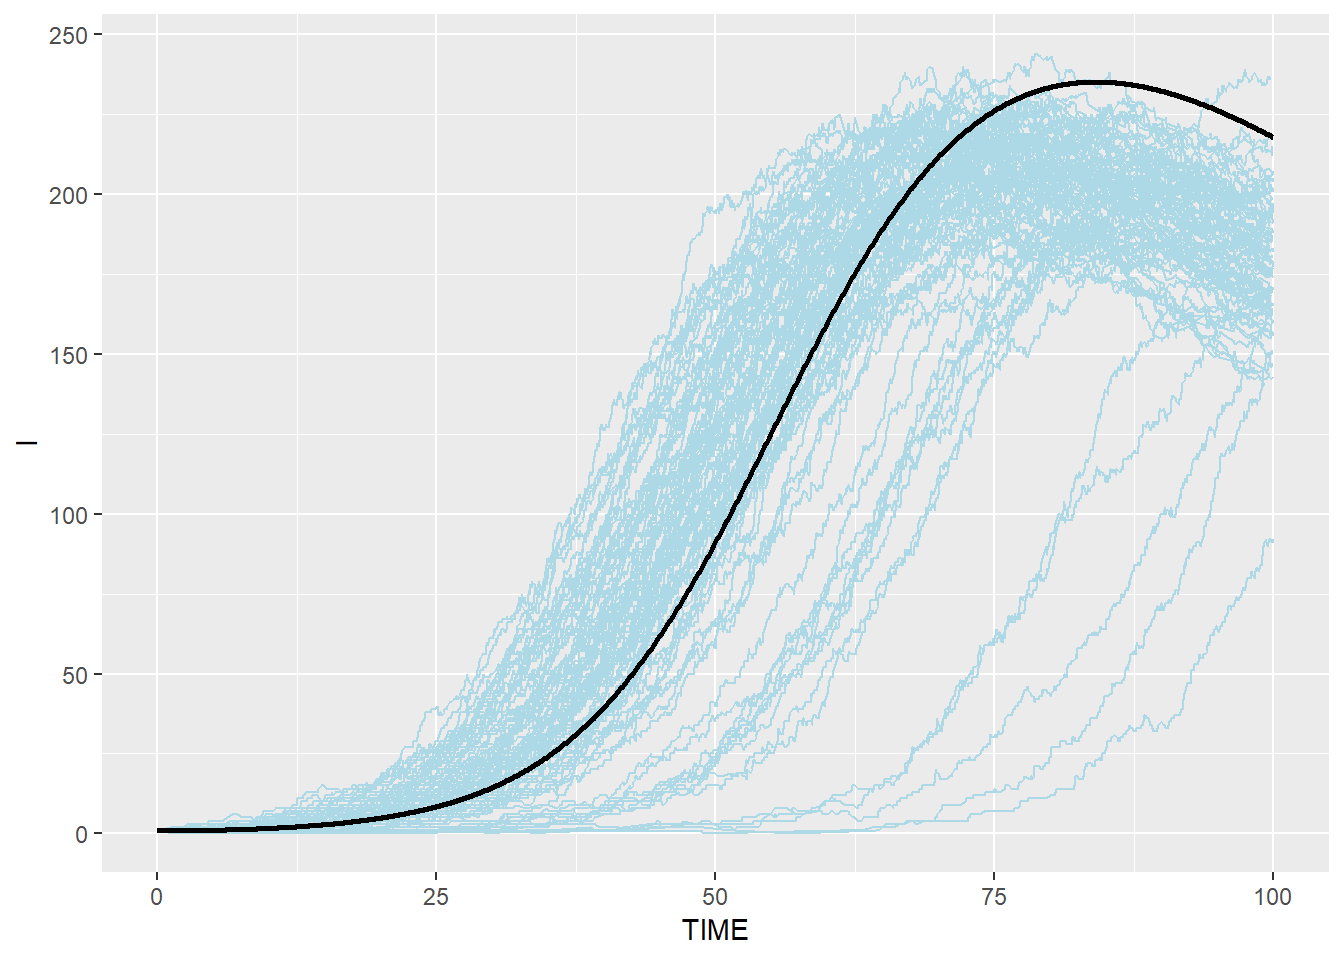
p_r_ssa_combined## geom_path: Each group consists of only one observation. Do you need to
## adjust the group aesthetic?
## geom_path: Each group consists of only one observation. Do you need to
## adjust the group aesthetic?
## geom_path: Each group consists of only one observation. Do you need to
## adjust the group aesthetic?
## geom_path: Each group consists of only one observation. Do you need to
## adjust the group aesthetic?
## geom_path: Each group consists of only one observation. Do you need to
## adjust the group aesthetic?
## geom_path: Each group consists of only one observation. Do you need to
## adjust the group aesthetic?
## geom_path: Each group consists of only one observation. Do you need to
## adjust the group aesthetic?
## geom_path: Each group consists of only one observation. Do you need to
## adjust the group aesthetic?
## geom_path: Each group consists of only one observation. Do you need to
## adjust the group aesthetic?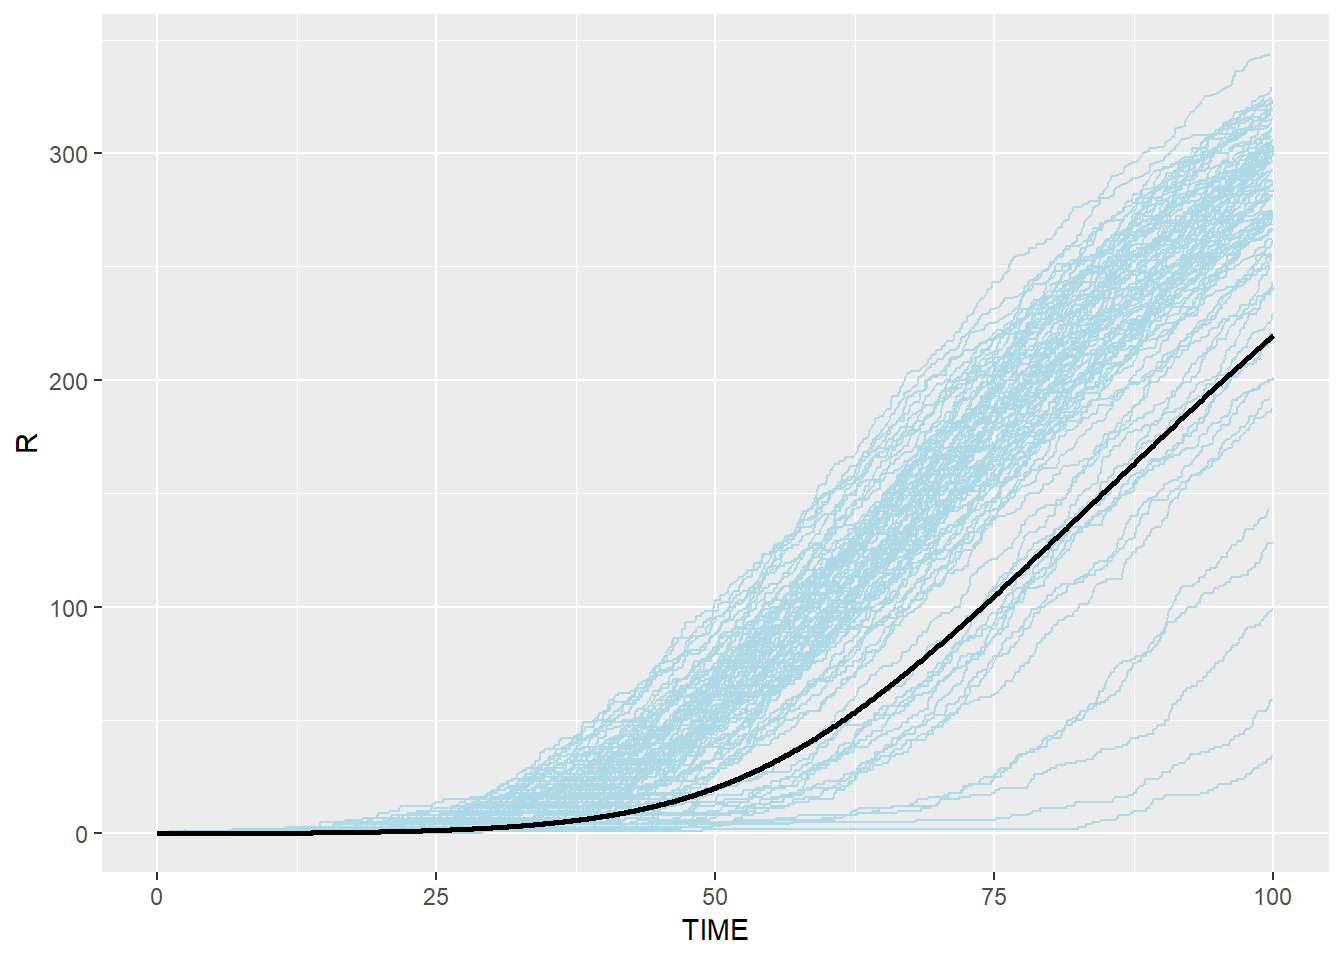
## Stochastic Gillespie results are surrounding the result from R ODE system

## Modified SSA
# Susceptible: blue(stochastic output from C) and black(ODE from R)
p_s_combined <- p_s + geom_line(data=SEIR.sol,aes(x=TIME,y=S),color="black",size=1)

# Exposed: blue(stochastic output from C) and black(ODE from R)
p_e_combined <- p_e + geom_line(data=SEIR.sol,aes(x=TIME,y=E),color="black",size=1)

# Infectious: blue(stochastic output from C) and black(ODE from R)
p_i_combined <- p_i + geom_line(data=SEIR.sol,aes(x=TIME,y=I),color="black",size=1)

# Immune: blue(stochastic output from C) and black(ODE from R)
p_r_combined <- p_r + geom_line(data=SEIR.sol,aes(x=TIME,y=R),color="black",size=1)

p_s_combined
## geom_path: Each group consists of only one observation. Do you need to
## adjust the group aesthetic?
## geom_path: Each group consists of only one observation. Do you need to
## adjust the group aesthetic?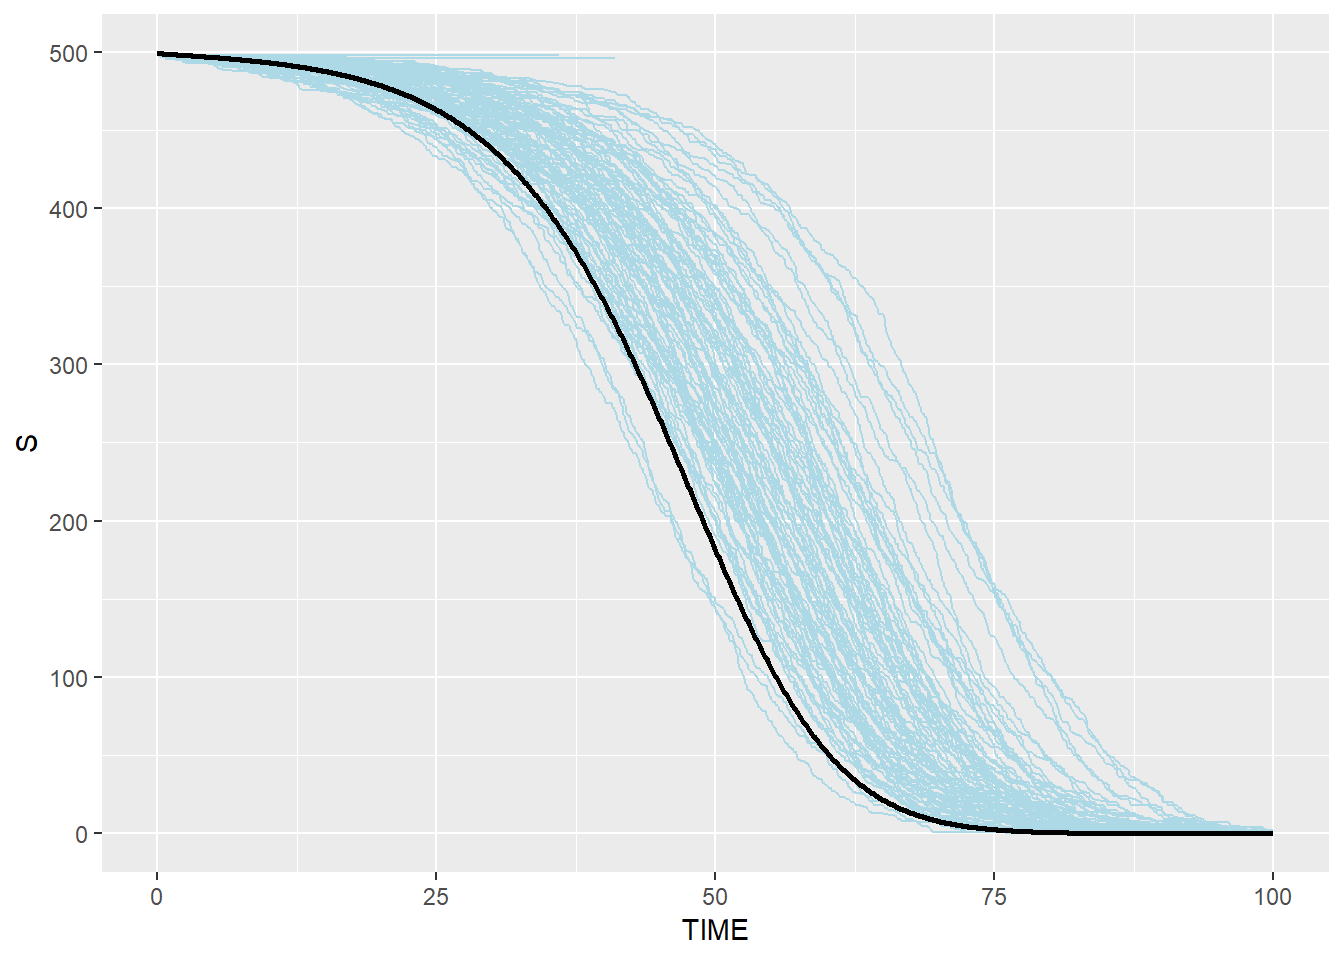
p_e_combined## geom_path: Each group consists of only one observation. Do you need to
## adjust the group aesthetic?
## geom_path: Each group consists of only one observation. Do you need to
## adjust the group aesthetic?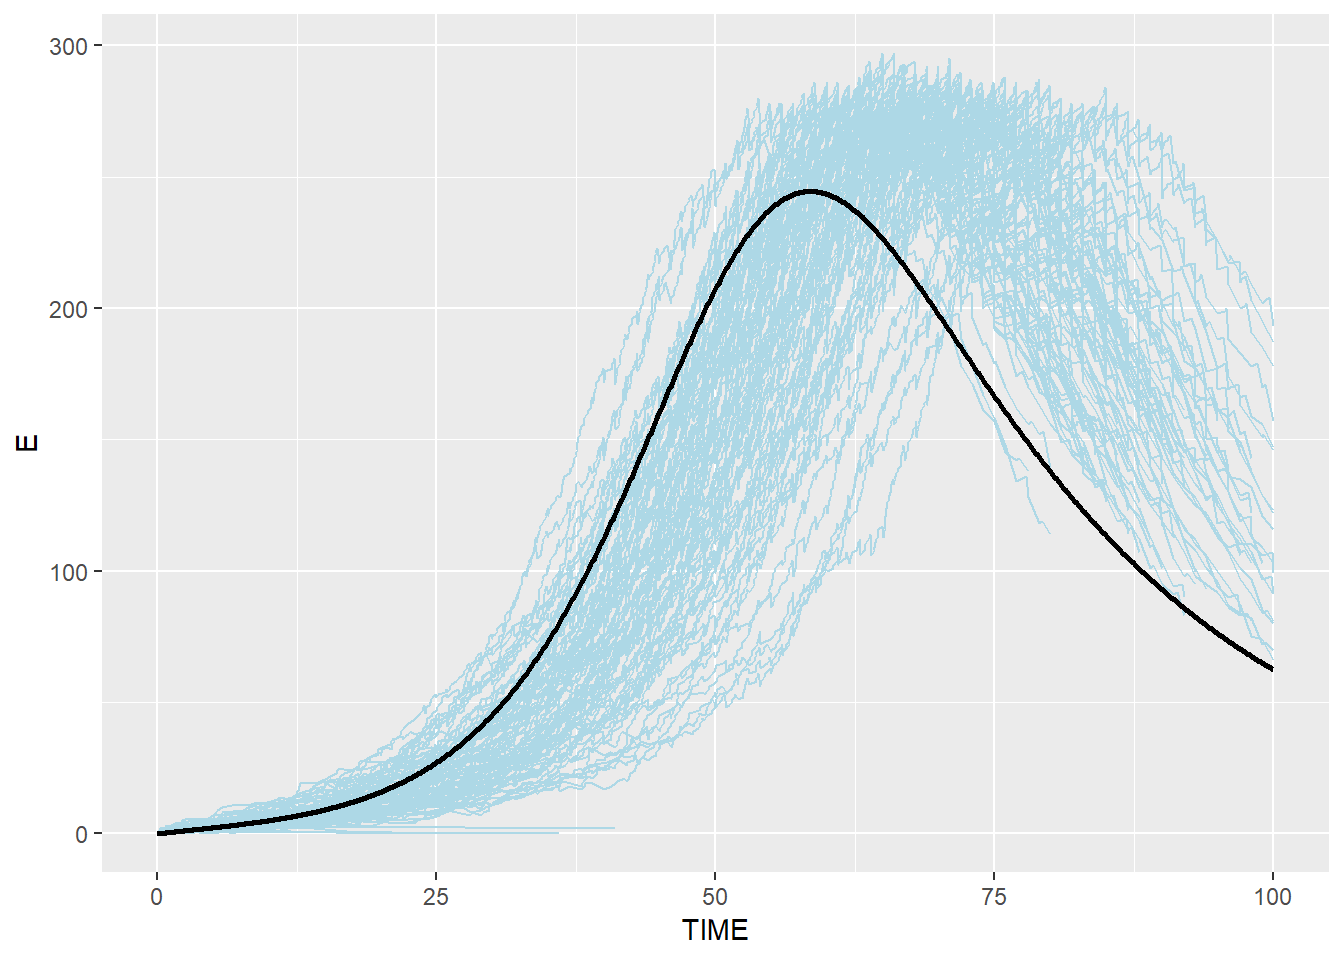
p_i_combined## geom_path: Each group consists of only one observation. Do you need to
## adjust the group aesthetic?
## geom_path: Each group consists of only one observation. Do you need to
## adjust the group aesthetic?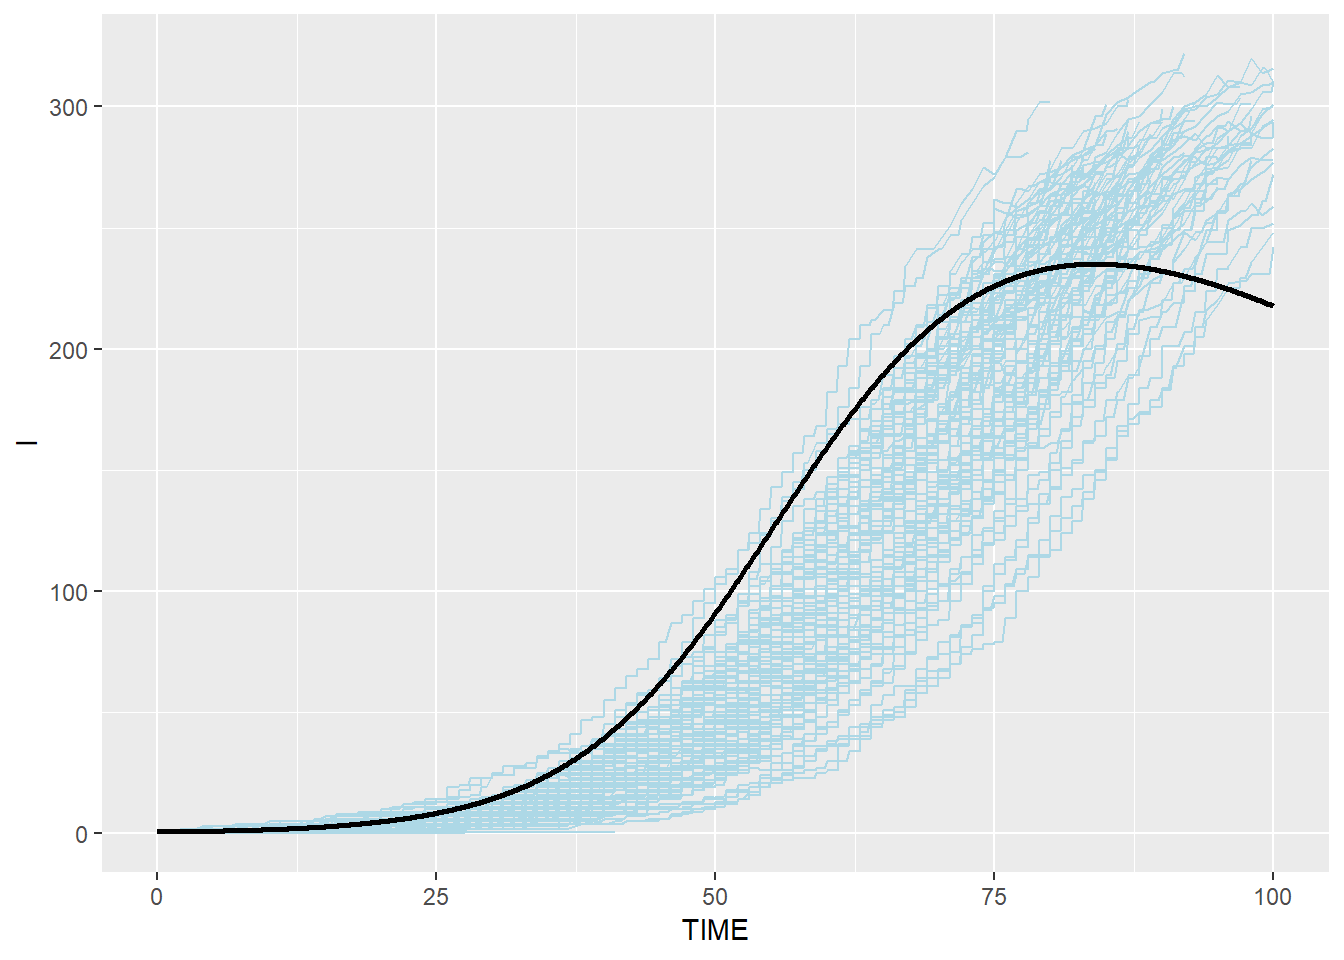
p_r_combined## geom_path: Each group consists of only one observation. Do you need to
## adjust the group aesthetic?
## geom_path: Each group consists of only one observation. Do you need to
## adjust the group aesthetic?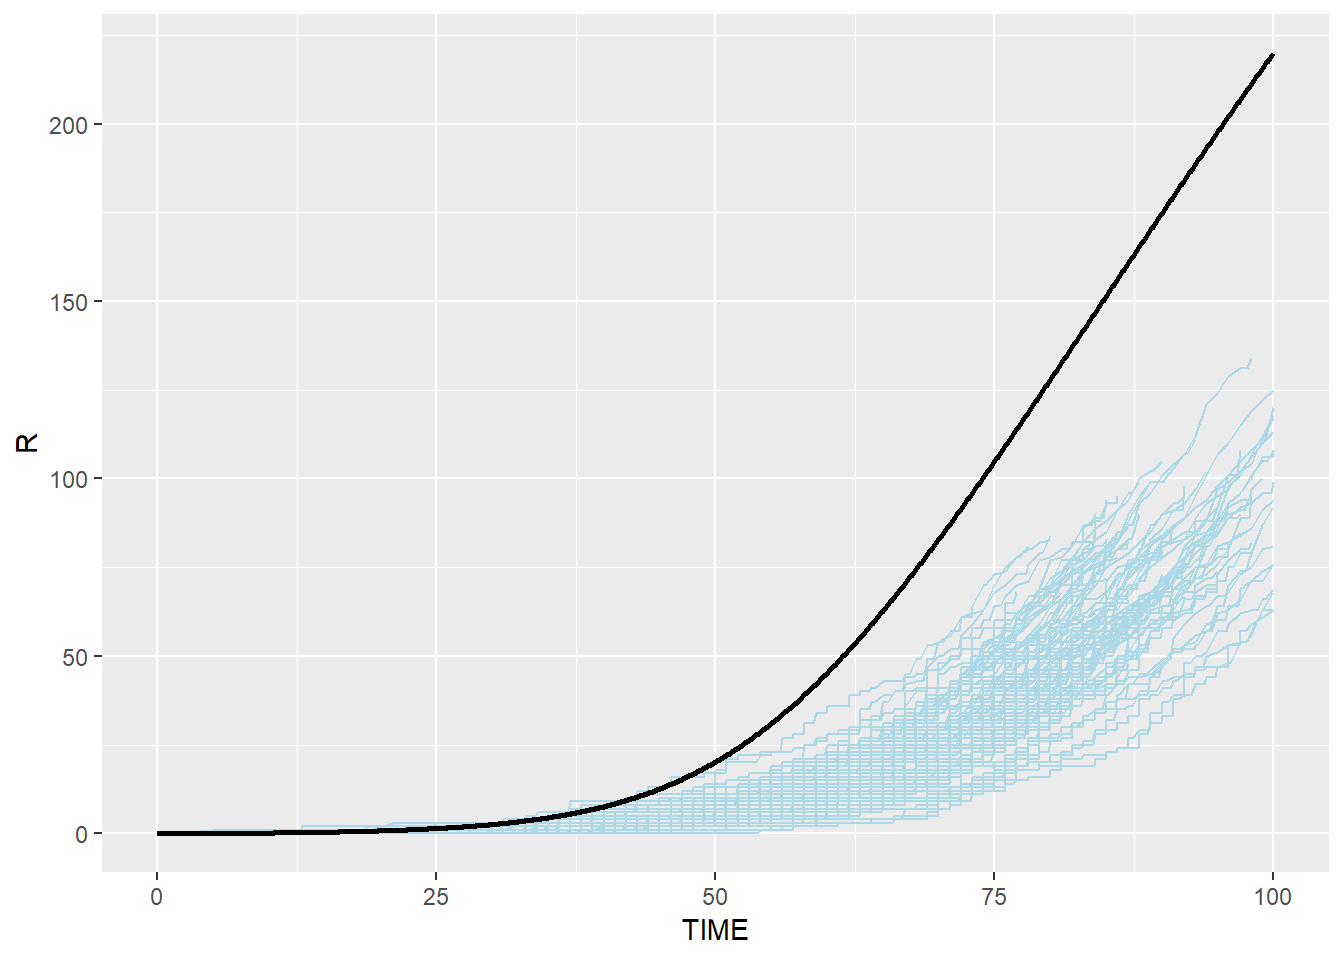
## Modified Stochastic Gillespie results are similar to R ODE system but not identical, especially for R group. This is because modified algorithm takes into account the duration which an individual spent in each disease status, which is more realistic than assuming that disease status change happens anytime (i.e. the probability of an individual moving to the next disease status is the same for an individual who spent 100 days in the status and an individual who spent only one day in the status)